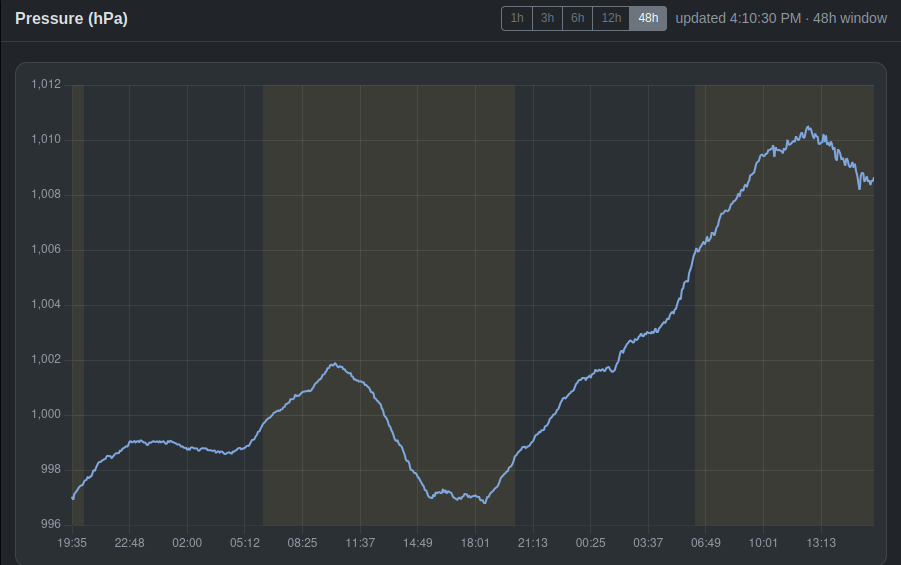
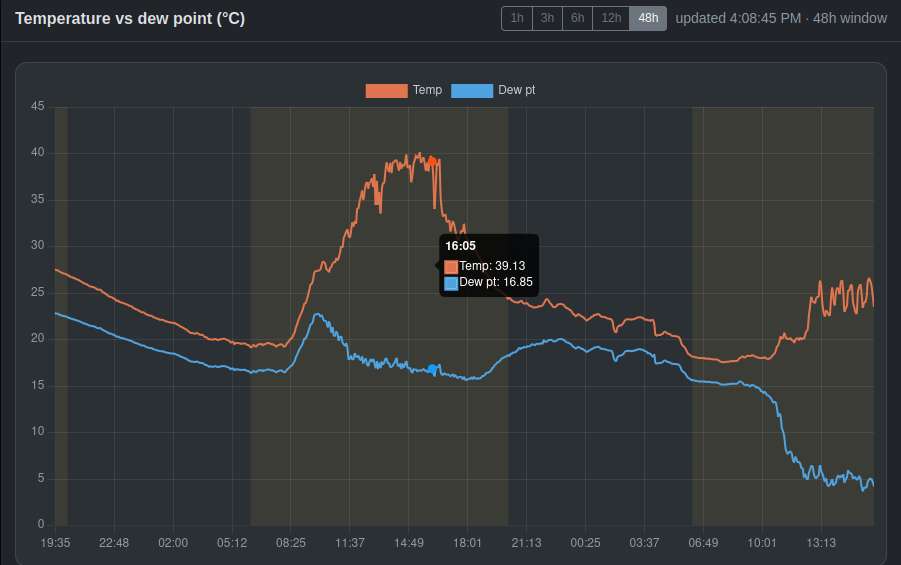
Charts with 48 Hours of Observed Conditions
Current Data is Available on the API
Double-Click any Plot to View Full Size.
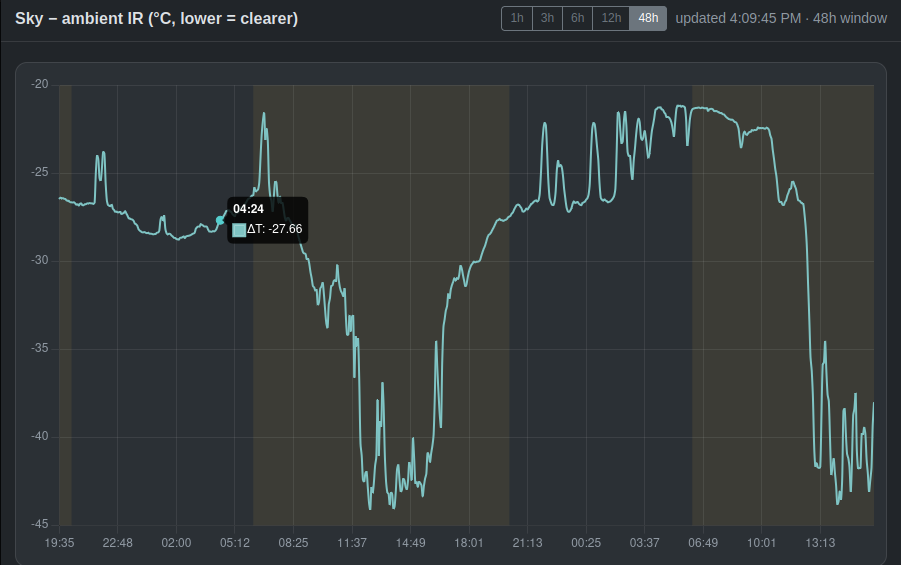
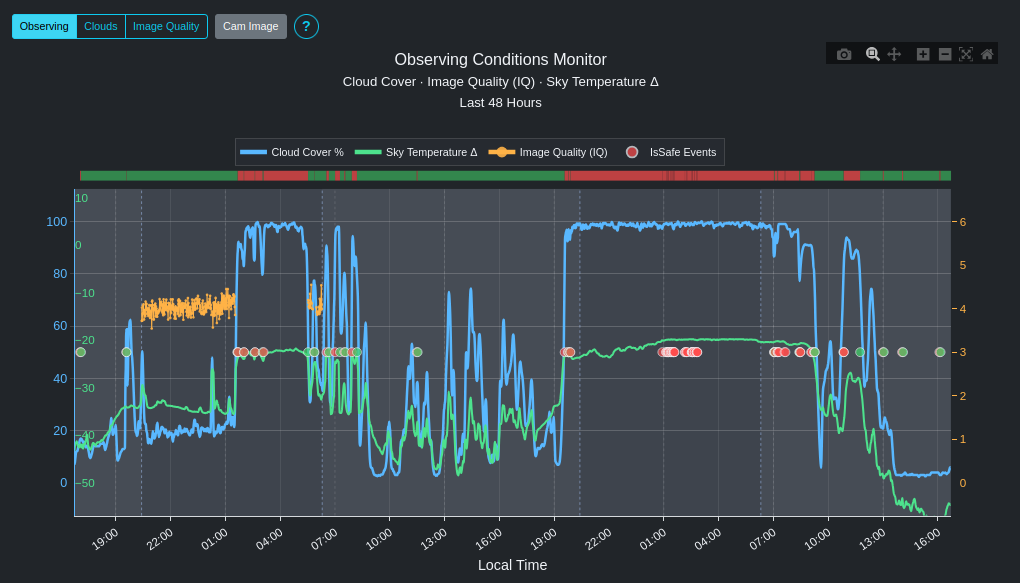
The Dashboard consolidates safety conditions into one chart. The green/red banner at the top shows safe/not safe according to the administrators settings.
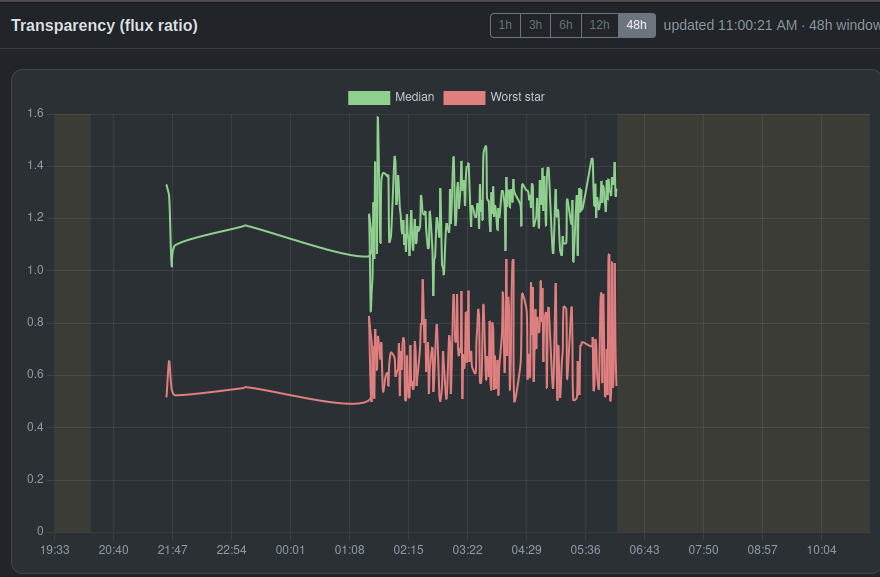
Median ratio of measured star flux to expected (catalog) flux across all reference stars in a frame. Values near 1.0 indicate normal, unobstructed transparency; lower values suggest clouds, haze, or other light-attenuating conditions.
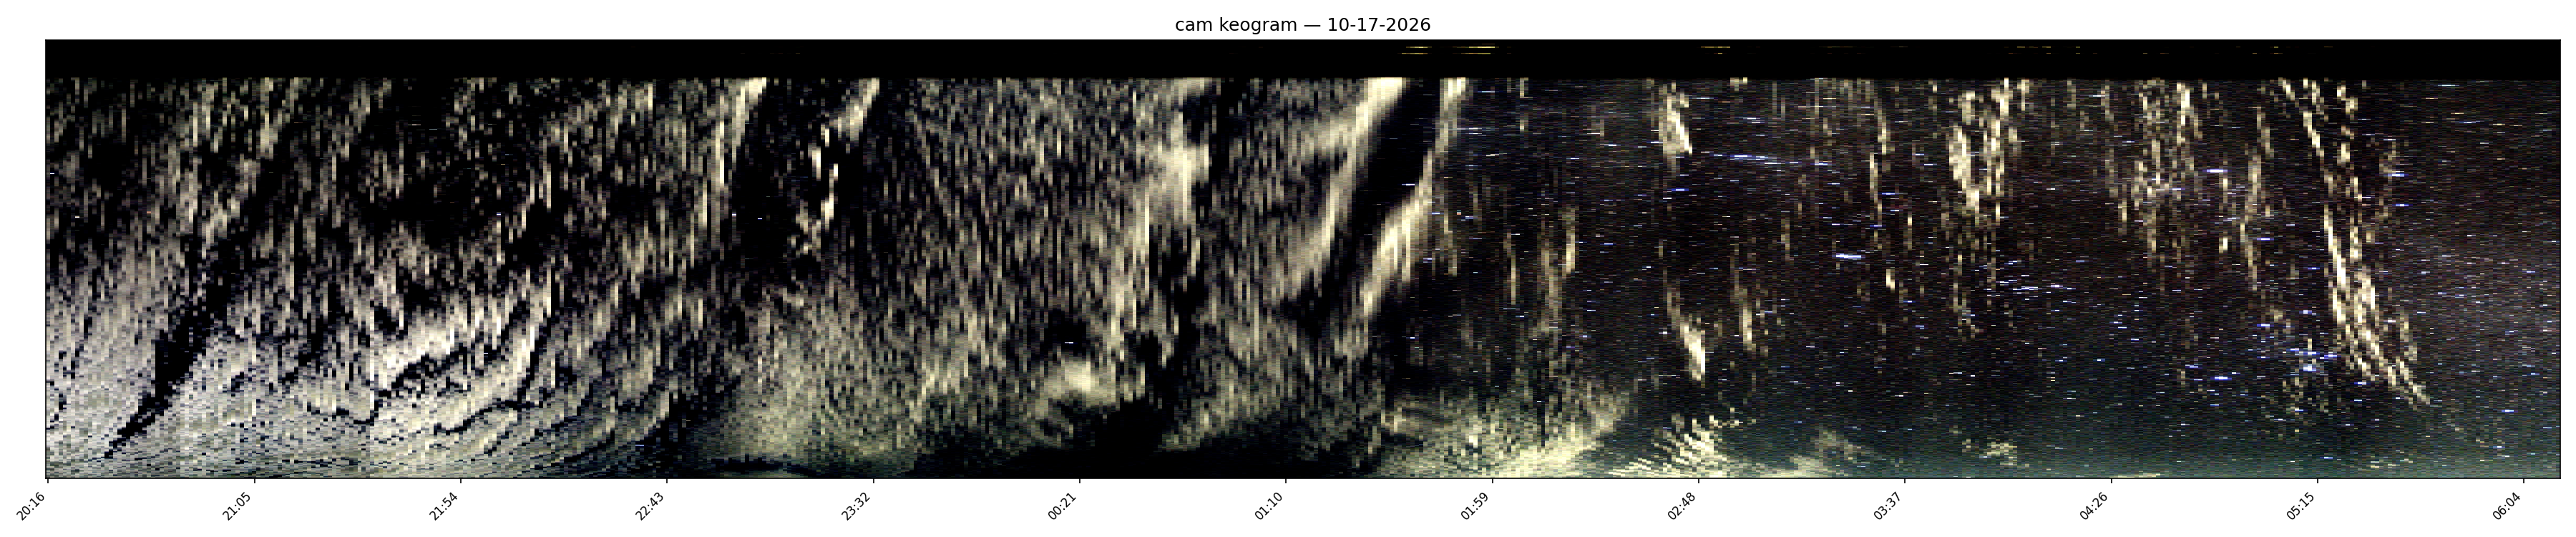
A keogram is a single summary image that displays the intensity, movement, and timing of an auroral display (such as the Northern or Southern Lights) over the course of a night. A narrow slice—a vertical column from the center of a series of time-lapse photos taken by TychoCam—is extracted from each sequential frame.